
Market structure Forex PDF explains the difference between internal and external structures, how to identify strong versus weak levels, and why higher timeframes provide the clearest directional bias. You’ll also learn how banks and institutional traders use market structure to position themselves, and how you can align your trades with their moves.
Introduction
Excerpts
Key thing to know, when we’re looking at TradingView data, broker data, from one
brokerage to another, or one data feed that you’re using on TradingView (for instance
Oanda vs FXCM), you’ll notice that wicks will differ. And why does that happen? Each
broker has access to different liquidity pools and fills, therefore price data feed they offer
will slightly vary from broker to broker. So essentially, when you are trading with a
brokerage, your spreads tend to increase or decrease depending on volatility in market
conditions and you can usually see that on a chart in the form of wicks. But if you’re
comparing the overall price action between one data provider and another, the one
thing that generally speaking remains very true are the candle bodies. You’ll see a little
bit of difference when you’re mapping out wicks when you’re looking at one broker,
one wick maybe in the denoted place, but on another broker, it might be actually
above.
Market structure shows us as institutional trader where the large majority of buy and
sell positions are being placed in the market; it illustrates what positions the banks are
currently in (net long/short) and the next major trade they could be placing. Market
structure is the first ‘brick layer’ of the house. Without understanding these concepts
there is no foundation to your trading. When you are able to understand structure from
a macro (Monthly, weekly) and micro (5,3,1 minute TF) perspective, that will put you
at the top 1% of your game, as you will understand when the banks are going to take
their next impulsive move in their specific bias. Then once you have your AOI (area of
interest), we can react accordingly on the micro timeframe to get a pin point sniper
entry and hold for long last RR trades.
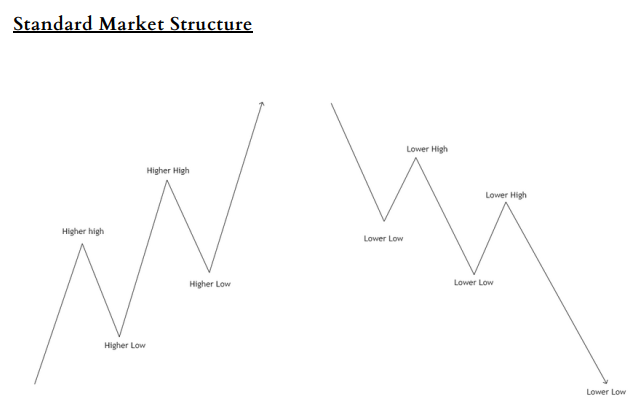
This will often be used on the bigger Timeframes: Monthly, Weekly, Daily and
sometimes 4 Hour. It gives us on overview in what direction price is going to trade
impulsively. If we are making HH’s and HL’s on the daily timeframe, we should expect
a new bullish trend continuation until we reach a valid AOI.
Multiplex Market Structure (Bullish)
There are two different Market structure types we look at: internal and external
structure. When we have internal structure, we have something called a multiplex
structure.
The best thing when trading a multiplex structure, that’s internal structure, is to always
start on the higher timeframes to get a general understanding of how price is moving.
Are we moving upwards creating higher highs and higher lows or are we moving
downwards creating lower highs and lower lows? Once you’ve determined that it
becomes more straight forward dropping down timeframes to determine the market
structure on those timeframes and correlating them. When specific bias is understood,
we can counter trade that specific trend if structure is present on the smaller/micro
timeframes. The diagram above is an accurate representation on how we would go
about trading a multiplex structure.