Liquidity and Manipulation [PDF] explores how banks, institutions, and professional traders create, hunt, and exploit liquidity zones to fuel market movements.
Introduction
Liquidity is the lifeblood of financial markets, but it is also the tool most often used to manipulate price. This Liquidity and Manipulation PDF explores how banks, institutions, and professional traders create, hunt, and exploit liquidity zones to fuel market movements. By understanding these dynamics, retail traders can avoid common traps and instead align their strategies with the smart money that drives price action.
Inside this guide, you’ll discover why popular retail concepts like support and resistance, double tops, and double bottoms are often targeted by liquidity grabs. The book explains how stop-loss clusters above equal highs (EQHs) and below equal lows (EQLs) become magnets for institutional players. Through clear examples and chart studies, you’ll see how manipulation occurs repeatedly, providing both risks and opportunities.
What makes this Liquidity and Manipulation PDF especially valuable is its practical approach to smart money concepts. You’ll learn how to identify liquidity pools, recognize fakeouts, and anticipate the moves that follow liquidity sweeps. Whether you trade forex, stocks, or indices, mastering these ideas will help you shift from a retail mindset to a professional perspective. By doing so, you can protect yourself from manipulation and use liquidity as a tool for smarter trading decisions.
Excerpts
The markets need to generate liquidity in order to move, so if liquidity isn´t
already there, it will be created. So when new traders come in to forex and
learn about it for the first time, what they usually do is gonna be retail based
trading.
So support and resistance, chart patterns which are extremely popular in the
industry, and things of that nature.
So what some brokers do is they offer free education for their clients once we
start trading. Now this education will usually be retail methods support and
resistance.
So why is this?
Well its simple, they want to generate liquidity into the markets, because the
majority of traders are trading this way. So these retail methods are not
unknown to large banks, and people with large interests. Of course they are not
all this information is out there for free, for anyone to go and we know seach
up.
So if all this information is available for free don´t think its wise to assume that
these people with huge amounts of money, they are going to use it against the
majority of retail traders in order to manipulate the markets.
So when we dig deep into chart patterns like the double top, double bottom or
bull flag, bear flag, which we know retail traders absolutely love this patterns.
We need to understand they are all manipulated and they only they do work
but only when we really know what we are doing, and how we can trade around
the manipulation, because there is a few people who talk about math
psychology and as long as we know whats going on and the math psychology
behind this patterns, we can still trade them definitely.
So what trade is a tool is to sell at double tops, or buy at double bottoms.
If we know this and large banks know this, what does that
really mean?
Well its means that theres is a lot of liquidity above or below this areas. So
there is a lot of luquidity above we know a double top or triple top, quadruple,
whatever. And there is liquidity below double bottoms.
So that is why we know double tops as EQHs and double bottoms as EQLs. We
expect price to be manipulated at and around this areas.
All we need to do is go back and look at the data, because its all there. So once
we see large moves up, sell size liquidity will usually need to be swept or
generated beforehand. That allow that move to actually we know impulsively
move.
Its basically fueled the move.
The same goes for when we large down moves by side liquidity will usually
need to swept or taken out prior.
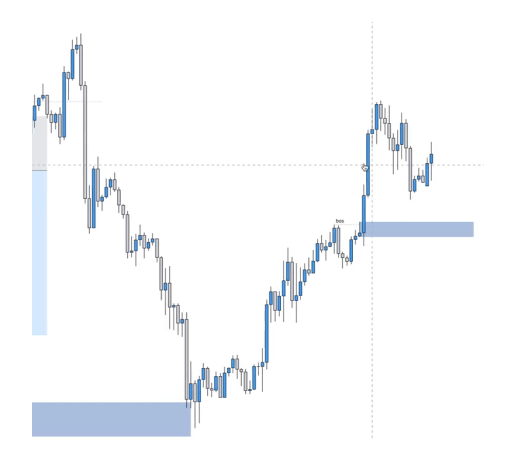
So now we have gone through that, what we wanna go through is this little
pattern, and what we can see from this pattern is price was pushing up, which
looks like and ascending channel, price then we had this high, we pushed
down, pulled back, pushed down, showing a little bit of a slow down in this
uptrend, and then price pushed down to this low.
So essentially we have a double bottom here, and price then pushes up to this
high, which is a double top….