Market Structure Made Easy [PDF] was created to simplify one of the most powerful concepts in trading, making it accessible for beginners and valuable for experienced traders.
Introduction
Mastering price movement starts with a clear understanding of market structure. This Market Structure Made Easy PDF was created to simplify one of the most powerful concepts in trading, making it accessible for beginners and valuable for experienced traders. Market structure provides the foundation for reading trends, identifying breakouts, and recognizing the shift between bullish and bearish conditions. By learning these principles, you can approach the markets with clarity and confidence.
Inside this guide, you’ll explore the basics of higher highs and higher lows, how to recognize break of structure (BOS) signals, and the importance of pullbacks. You’ll also discover how to distinguish strong versus weak highs and lows, giving you a clear framework for building trade setups. Advanced sections cover swing, internal, and fractal structures—helping you refine your analysis across different timeframes and market conditions.
What makes this Market Structure Made Easy PDF stand out is its step-by-step approach. Each concept is explained with simple examples, making it easy to follow and apply directly to real charts. Whether your goal is to day trade or swing trade, understanding market structure will give you the edge needed to stay on the right side of price action consistently.
Excerpts
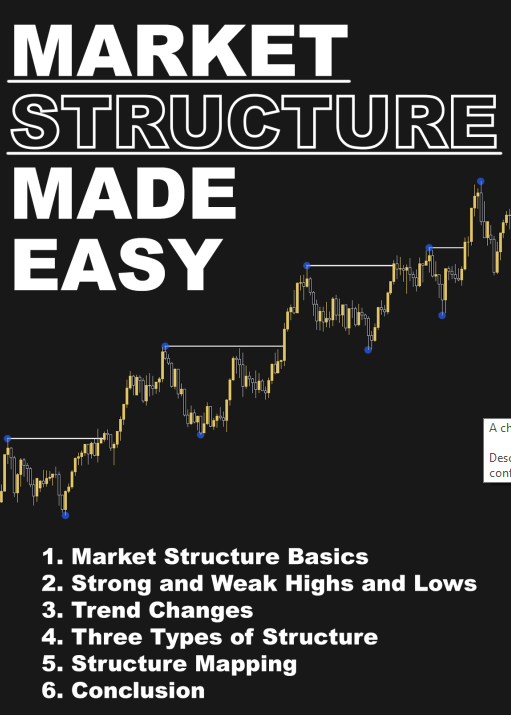
1. Market Structure Basics
Market structure underpins the fundamental concepts used in this trading strategy. If you
can master market structure, you will likely be on the right side of the market more often
than not. And the good news is, it’s easy to learn!
For simplicity, I will use bullish examples throughout this workbook, but you can apply the
exact same concepts to bearish examples just in the opposite way.
The fundamental idea behind market structure is that when a high is broken, we have a
confirmed higher low. The actual act of breaking the high ‘cements’ the higher low, so price
can print many different candles in between, but a break of structure is only confirmed after
the high is breached. After a BOS (break of structure) occurs, we expect price to pull back.
A series of HIGHER HIGHS and HIGHER LOWS gives a bullish trend.
A series of LOWER LOWS and LOWER HIGHS gives a bearish trend.
Once we have a BOS, we expect a pullback
So, what does this mean?
Well, it means exactly that; once we have a BOS, we expect a pullback at some point. This
pullback can form straight away after the BOS, or price can go on for a long time before
pulling back, BUT, after the BOS, we expect a pullback at some point. This phrase is
extremely useful to bear in mind and I use it instinctively when looking at the charts. It
allows us to get a bias of where price is likely to be heading next, giving us a bias for going
long or short.
If we have had a bullish BOS and we are at the point in the white box:
We need to expect a pullback. This pullback can
happen straight away, or it may take a while, but we
expect a pullback. Therefore, our directional bias is to
take SHORTS to play the pullback.