Price Action Strategy Using Liquidity Zones provides traders with a step-by-step framework to identify high-probability trade setups using liquidity pockets where stop-loss orders accumulate.
Introduction
Price action trading remains one of the most effective methods for understanding market behavior, and liquidity zones are at the heart of this approach. This Price Action Strategy Using Liquidity Zones PDF provides traders with a step-by-step framework to identify high-probability trade setups using liquidity pockets where stop-loss orders accumulate. By learning to recognize these zones, you can anticipate false breakouts, avoid retail traps, and align your trades with institutional moves.
Inside, the guide explains how to mark key liquidity levels such as previous day highs and lows, intraday swing points, and round numbers. You’ll also discover how to confirm liquidity grabs with rejection candlestick patterns like hammers, engulfing candles, or shooting stars. Each section walks you through precise entry techniques, stop-loss placement, and profit targets, ensuring you trade with discipline and clarity.
What makes this Price Action Strategy Using Liquidity Zones PDF especially practical is its focus on real-world application. Clear examples and summary tables make the strategies easy to follow, whether you’re trading forex, stocks, or indices. With proper risk management and confirmation signals, this approach gives traders a repeatable system to identify reversals and continuations, making liquidity-based price action trading both simple and powerful.
Excerpts
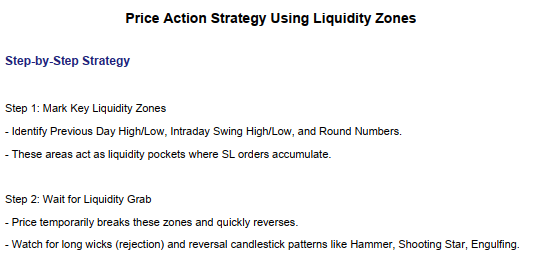
Step 1: Mark Key Liquidity Zones
– Identify Previous Day High/Low, Intraday Swing High/Low, and Round Numbers.
– These areas act as liquidity pockets where SL orders accumulate.
Step 2: Wait for Liquidity Grab
– Price temporarily breaks these zones and quickly reverses.
– Watch for long wicks (rejection) and reversal candlestick patterns like Hammer, Shooting Star, Engulfing.
Step 3: Confirm with Candle Close
– Only enter a trade after a reversal candle closes against the fake breakout.
– Look for strong rejection and possibly higher volume.
Step 4: Entry, Stop-loss & Target
Short Setup:
– Entry: After bearish reversal candle
– SL: Above the wick
– Target: Next support or 1:2 RR
Long Setup:
– Entry: After bullish reversal candle
– SL: Below the wick
– Target: Next resistance or 1:2 RR
Example (Nifty 50 Intraday):
– Resistance: 22500
– Price spikes to 22530, closes below 22500 with Shooting Star
– Entry: Short at 22480 | SL: 22535 | Target: 22380
